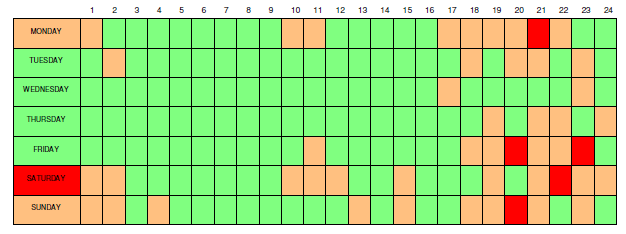
The Crime AnalySIS Toolkit enables you to create block charts of incident activity, depicting the spread of incidents over 24 hours for each day of the week, or the spread of incidents over 12 months for each day of the week. Combined with the filtering tools described above, these charts provide valuable analysis of incidents to aid in resource planning on both a daily basis and over the longer term.
Map Modeller enables the incident data to be spatially filtered, so periodic charts can be created to analyse data within a specified area, as well as filtering by incident type.

Criminal Damage within City Centre
The charts highlight periods of high, medium and low activity. By default the three categories are based upon an equal spread. Thus if the minimum number of incidents in any period is 0, and the maximum is 20, the category ranges would be taken as low = 0-6, medium = 7-13 and high = 14 to 20.
Using the standard Ranges Theme available from the Create New Theme dialog in Map Modeller the charts can be quickly and simply presented in a number of ways to best depict the data being analysed. There can be between 2 and 100 ranges, with individual control over the colouration. Label Themes may be added to display the actual number of incidents to supplement the coloured Ranges Theme.
In order to create periodic charts it is essential that there is a Date/Time column in the Schema.
Date and time can be Date@, String$, Floating Point# or Integer& data types. Note there is no time component in the Integer& data type.
Where your data is displayed directly from a database table or view which holds a Date/Time field, this will automatically be presented in the correct format by Map Modeller.
If your incidents have been recorded with Date and Time as separate fields in a different format it will be necessary to add a schema column to the data overlay to present the date/time in the required format. This can either be done in the database itself, or using the CvDate function in the Formula dialog in Map Modeller.
Note: CvDate is a simple means of creating the (possibly complex) formula to chain together the date and time then convert it to a date/timestamp.
Provided your data holds a valid date/timestamp, simply select this column from the drop down list:
When you have set any filter you require and selected the date/time column, simply click the Crime Analysis dialog Create Chart… button:

The Periodic Charts dialog will be displayed as follows:
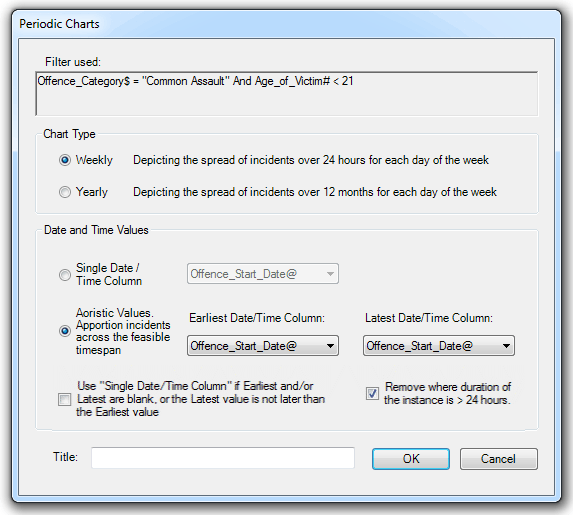
The default settings are Chart Type set to Weekly with Single Date/Time Column selected.
Single Date/Time Column - Choose this option if only a single date/time column is to be used rather than a range. If data for this column is missing from any records a message will be displayed informing you of this.
Aoristic Values. Apportion incidents across the feasible timespan - Enter the earliest and latest date/time columns to create the required range.
Use "Single Date/Time Column" if Earliest and/or Latest are blank, or the Latest value is not later than the Earliest value - If you check this tickbox and there are any missing date/time data in the earliest or latest date/time columns, or if any "earliest" date/times are greater than the "latest" date/times, the chart will be created as for the Single Date/Time Column entry. If the Single Date/Time Column is not correctly set click its radio button, set the column, and then re-activate Aoristic Values. Apportion incidents across the feasible timespan.
Remove where duration of the instance is > 24 hours - Check this tickbox to remove any instances that are spread over more than 24 hours, this prevents the probability values being divided over a number of days.
Title - Enter the required Chart name; this name will be displayed below the chart in the Map Window
The following are examples of the results that may be achieved with the various Chart Type and Date and Time Values settings in the above dialog.
Weekly - Depicting the spread of incidents over 24 hours for each day of the week.
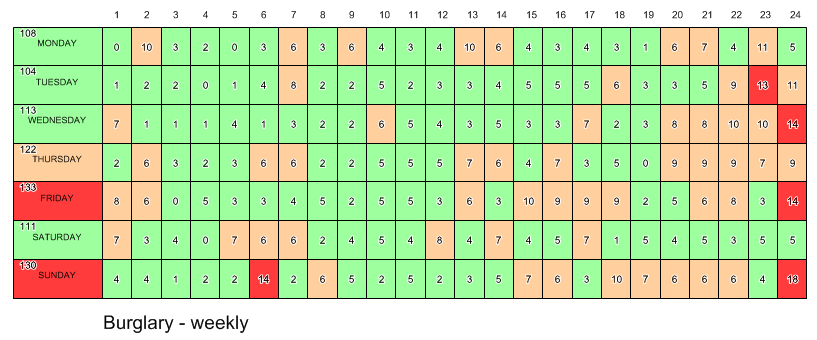
Yearly - Depicting the spread of incidents over 12 months for each day of the week.
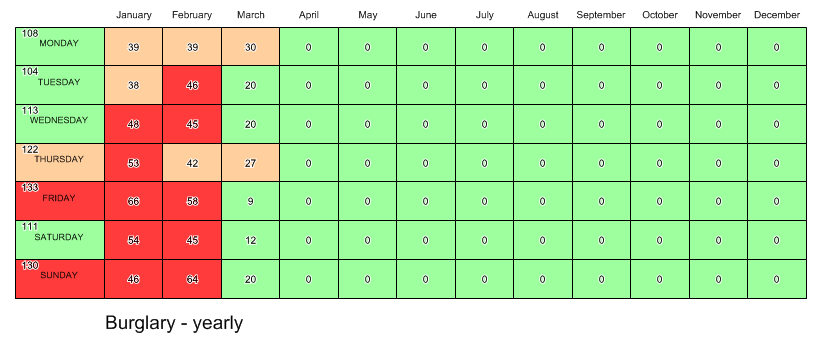
Weekly and Single Date/Time Column
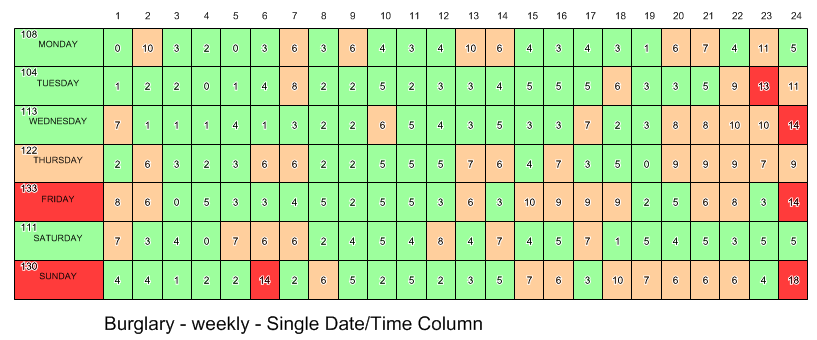
Weekly and Aoristic Values. Apportions incidents across the feasible timespan
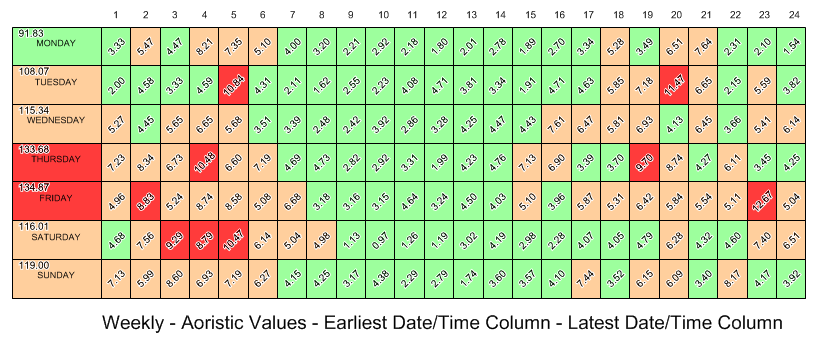
The chart is created from three Cadcorp Base Dataset (BDS) files stored in the Program Files\Cadcorp SIS 7.1\Addins\CrimeAnalysisToolkit\Chart folder:
These files are copied into a new SIS Window Definition (SWD) and the cells of the chart are populated with the results of the analysis. A Theme can be applied to indicate time periods of low, medium or high incident activity as described earlier in this topic.
Send comments on this topic.
Click to return to www.cadcorp.com
© Copyright 2000-2017 Computer Aided Development Corporation Limited (Cadcorp).